Big Picture · Week of 31 August 2026
What the Talking
Headge Said.
Talking heads on US markets publish on their own YouTube channels and X handles. Headge turns those posts and videos into short, source-backed views of who said it, about what, which direction, and over which horizon, so the catch-up takes fifteen minutes.
AI capex bubble is likely to precede a secular bear market beginning in the second half of 2027 or first half of 2028.
Darius Dale BEARISH
Sentiment Graph
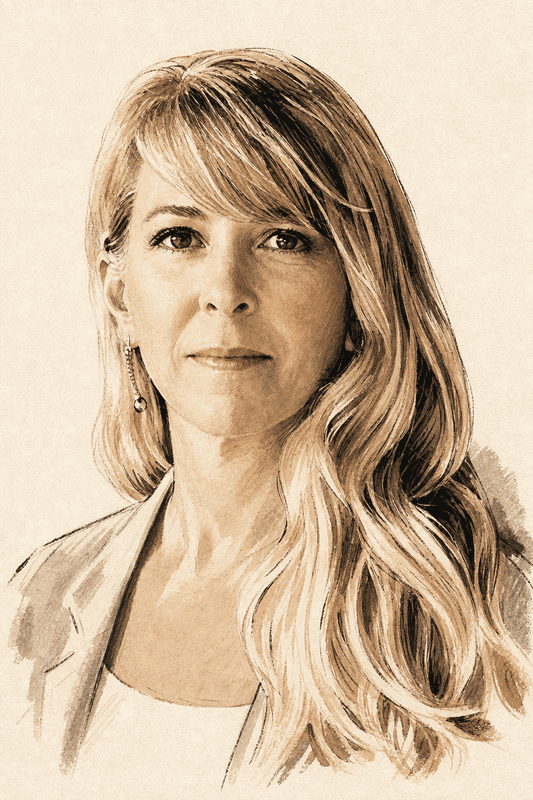
Every portrait is one talking head and every disc is one topic. An edge is one attributed view, inked by that analyst's sentiment. A disc fills with that topic's split of analysts, Bull rising in green from the bottom and Bear in red from the top, Neutral between; its frame is the mean sentiment of the analysts on it, as is the frame around each portrait. Scrub or play the last thirty days to watch views arrive, flip, and lapse. Counts and means only, never a house view.
New Views Today
LatestBullish

Bitcoin has bounced so far after reaching the 79,420 bid level, indicating a near-term technical rebound is underway.

Oil faces persistent global energy-market bottlenecks from longer shipping routes, higher insurance costs, and limited refinery capacity despite renewed Strait of Hormuz flows.

GPU investments bought since 2021 have outperformed their depreciation costs by a wide margin, undermining concerns about AI infrastructure depreciation risk.
Bearish
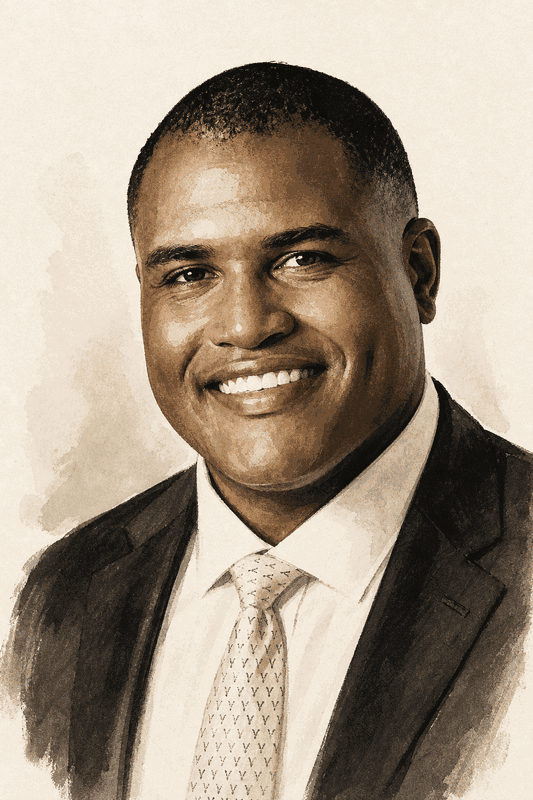
AI capex bubble is likely to precede a secular bear market beginning in the second half of 2027 or first half of 2028.

Housing investment has been weak for four years and recent higher interest rates will likely worsen the housing market outlook.
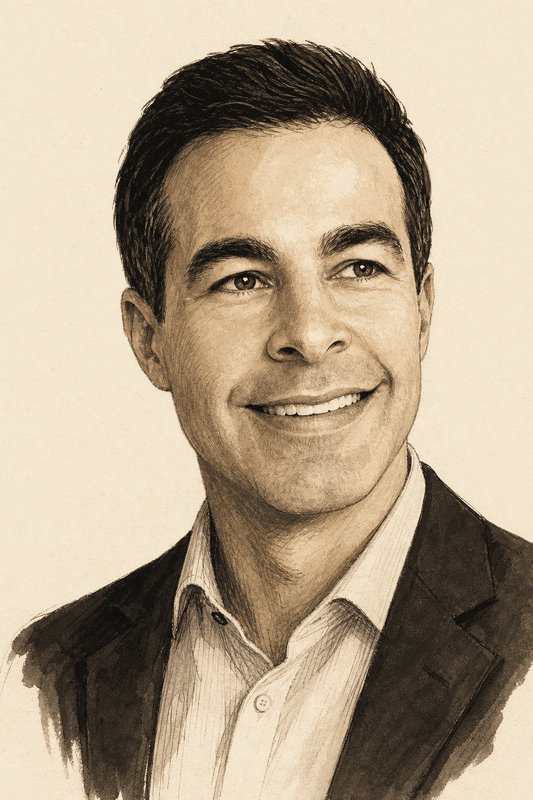
Positioning may shift away from speculative beta toward quality, cash flow, profitability, balance-sheet strength, and earnings momentum in the next cycle phase.
1 Week Horizon
Shannon · BTC Brandt · USO
 Kochuba · Positioning & Vol
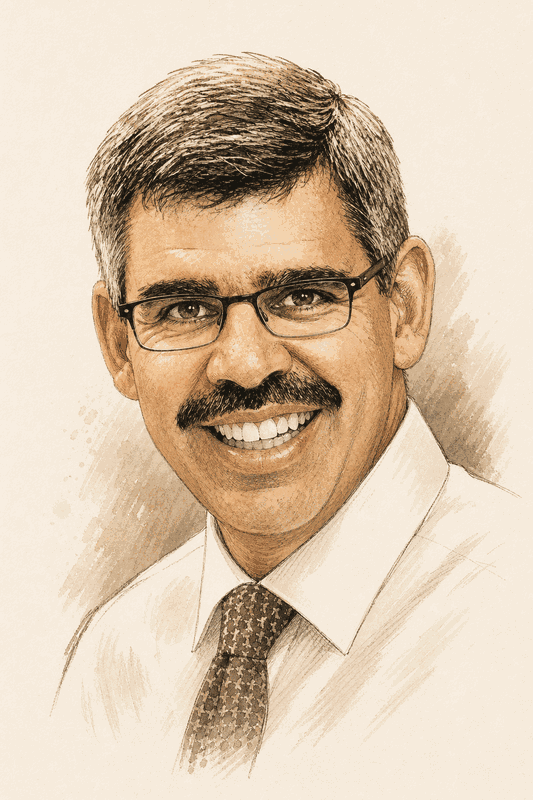 El-Erian · QQQ
 Schiff · BTC
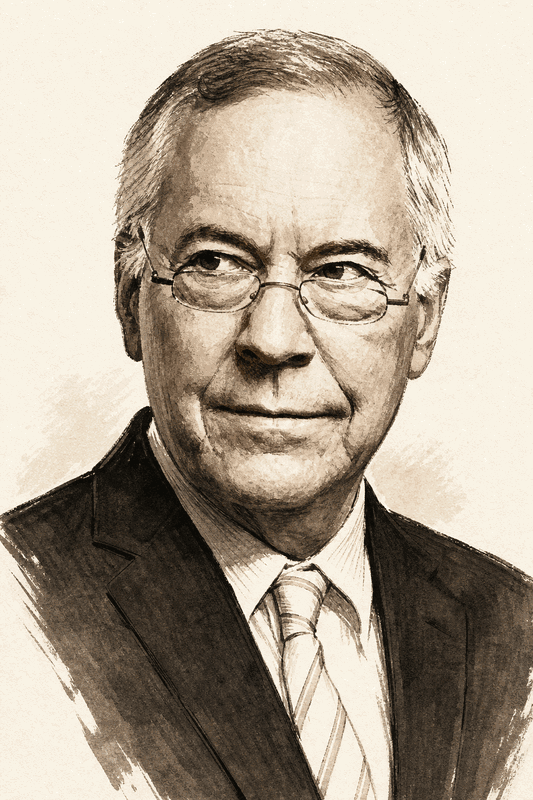 Hanke · USO
 Mancini · SPY Shannon · SPY Shannon · NVDA Shannon · AAPL Shannon · TSLA Shannon · TLT Shannon · IBB Shannon · IWM Shannon · TXN Shannon · MU Shannon · INTC Shannon · SMH Shannon · QQQ
 McCullough · KRUS McCullough · EWZ McCullough · BUG
 Keller · META Steno Larsen · SPY
1 Month Horizon
Snider · USO Hanke · USO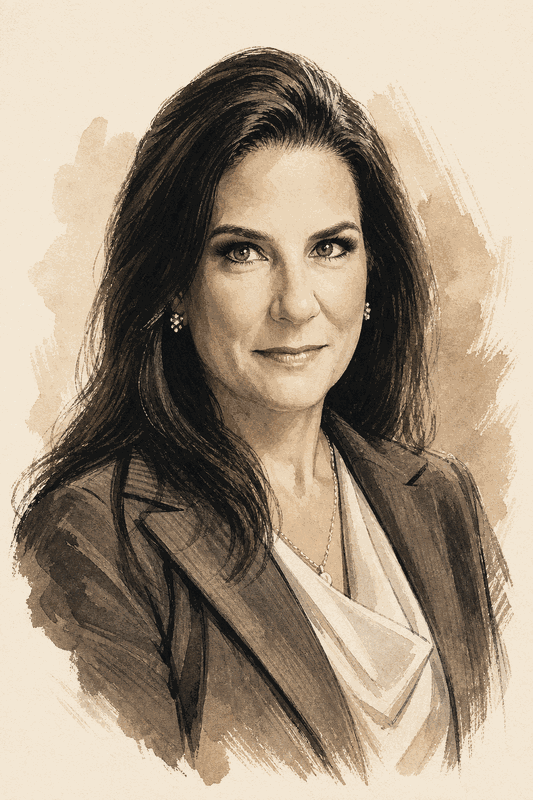 DiMartino Booth · Housing McCullough · TLT
 Roberts · Inflation Roberts · Growth Kantrowitz · SPY Hanke · AI
 Elliott · TLT Hanke · Tariffs & Geopolitics Basmajian · Growth Shannon · GLD Shannon · BTC Shannon · XLF
 Bianco · Fed Policy Bianco · TLT Dale · Positioning & Vol Dale · Growth
 Sonders · Inflation Sonders · Growth DiMartino Booth · AXP El-Erian · Fed Policy El-Erian · Inflation Basmajian · Housing
 Oil faces persistent global energy-market bottlenecks from longer shipping routes, higher insurance costs, and limited refinery capacity despite renewed Strait of Hormuz flows.
1 Year Horizon
Dale · AI Basmajian · Housing Basmajian · Growth Basmajian · Fiscal & Treasury Kantrowitz · Positioning & Vol Kantrowitz · Growth Kantrowitz · AI Kantrowitz · Earnings Steno Larsen · AI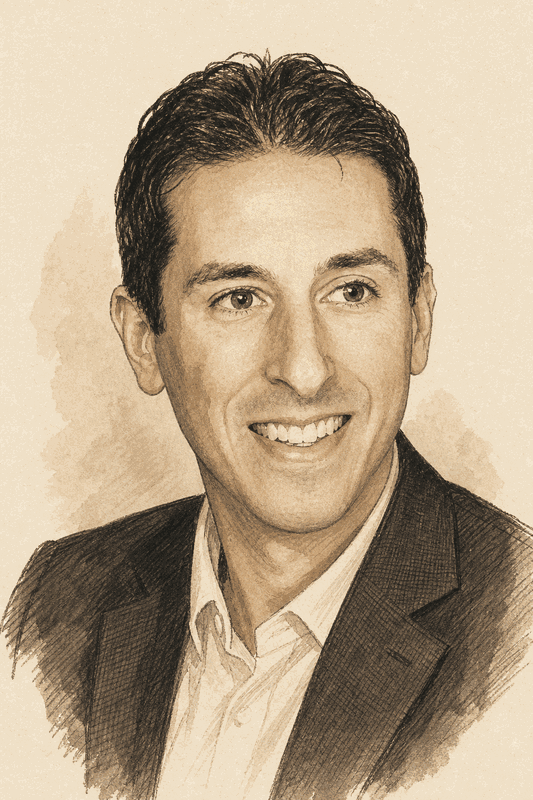 Bilello · BTC Bilello · GLD Roberts · Positioning & Vol Roberts · AI Elliott · USO
 Woo · USO Hanke · DXY
 Lee · AI El-Erian · AI DiMartino Booth · AI
 Timmer · BTC Timmer · GLD Timmer · TLT Timmer · DXY Bianco · Inflation
Daily Catch-Up
Latest Video
Healthcare Strength, Small-Cap Strain | Headge Catch-Up, 21 Sep
The day’s talking heads, market moves, and attributed views in one short catch-up.
Watch On YouTubeMoved Since Yesterday
Roberts · Inflation Higher oil prices and geopolitical tensions involving Iran threaten additional inflationary pressure, squeezing households as price gains outpace wage growth.
Where They Diverge
Words
Headge Model
Open The ModelAfter a move like this, what happened next? Load a scenario or a talking head's view and read what followed across every asset class, in a century of monthly data.
Method
How Headge Works
- 01
Discover
Talking heads publish on their own YouTube channels and X handles. Headge credits the speaker, never the venue that hosted them.
- 02
Place
Each directional claim lands on one topic, with a horizon and a source. If it cannot be placed confidently, there is No View — not a guess.
- 03
Read
Start with Latest, then the 1 Week, 1 Month, and 1 Year horizons. Open a portrait for the analyst, or a summary for the topic.
-
Source-Backed
Every view links to the original post or the exact YouTube moment.
-
Closed Catalog
A view occupies one named topic. Headge does not invent a new one to make it fit.
-
Mix Is a Count
Bull, Neutral, and Bear are tallies of unique analysts, not a house call.
Questions
- What Is Headge?
- Headge is a daily catch-up of talking heads. It turns public YouTube videos and X posts from tracked market analysts into short, attributed, source-backed views on a closed catalog of topics, so a reader can see who said what, on which market, in which direction, and over which horizon, in about fifteen minutes.
- Where Do the Views Come From?
- Every view comes from a public source: a YouTube video or an X post by the analyst. Headge transcribes or reads the source, places each directional claim on one topic with a horizon, and links back to the original post or the exact video moment. If a claim cannot be placed confidently, the outcome is No View, never a guess.
- Is Headge Investment Advice?
- No. Views are machine paraphrases of what an analyst said in public, attributed to that analyst. Headge has no house view, does not say buy or sell, and does not rank or grade analysts. Paraphrases can be wrong, so check the source before acting on anything.
- What Do Mix and Sentiment Mean?
- Mix is a count of unique analysts who are Bull, Neutral, or Bear on a topic, not a consensus. Sentiment is how strongly an analyst stated a claim, shown as Weak, Moderate, or Strong. Both are counts and means of attributed views, never a score Headge assigns to the market.
- How Fresh Are the Views?
- Sources are ingested through the day and each view carries the time it was recorded. A view stays on the board until the analyst restates or changes it, and it is marked stale after five days. The Front, Latest, and topic pages show the latest view per analyst, topic, and horizon.
- Can an AI Agent Read Headge?
- Yes. The same attributed views are available compact and citable at /for-agents, /llms.txt, /api/agents, and over MCP at /mcp, in Markdown for models and JSON for scripts.