Open Interest
Volume tells you how many contracts changed hands. Open interest tells you how many contracts exist. This distinction matters more than most traders realise. High volume with rising open interest means new positions are being established. High volume with falling open interest means existing positions are being closed. Same volume, completely different implications.
Open interest is the overlooked edge in futures and options markets. It reveals whether money is flowing into or out of a market, whether a move has fresh commitment behind it or is simply position shuffling.
Open interest is the total number of outstanding contracts that have not been closed or delivered. Every futures or options contract has 2 sides: a buyer and a seller. 1 open interest unit represents 1 contract held by a buyer and the corresponding obligation held by a seller. When open interest increases, a new buyer and a new seller have entered the market. Both are establishing new positions. Fresh money is flowing in. When open interest decreases, an existing buyer and an existing seller have closed their positions. Money is flowing out. When open interest stays flat, for every new position opened, another position was closed. The market is churning but not growing or shrinking.
Open interest measures how much committed capital exists in a market. Rising OI means growing commitment. Falling OI means waning commitment. Volume alone cannot tell you this.
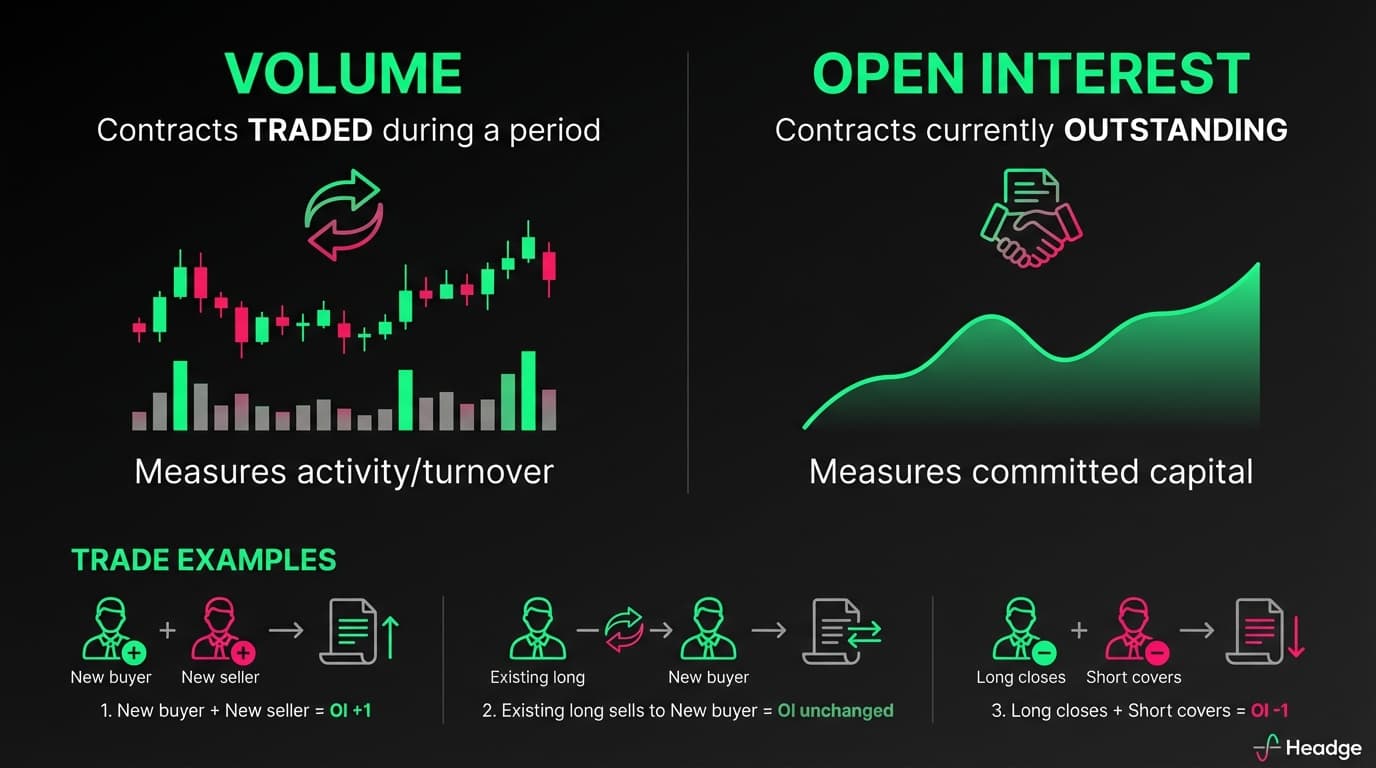
Volume and open interest are often confused, but they measure different things. Volume measures contracts traded during a period. Open interest measures contracts currently outstanding. Consider 3 trades to understand the difference.
Trader A who is new buys from Trader B who is also new. Volume increases by 1, open interest increases by 1. Both are establishing new positions.
Trader A who is an existing long sells to Trader C who is new. Volume increases by 1, open interest unchanged. 1 position closed, 1 position opened.
Trader A who is an existing long sells to Trader B who is an existing short covering. Volume increases by 1, open interest decreases by 1. Both are closing positions.
Same volume in all 3 cases. Completely different open interest implications. The third trade represents money leaving the market entirely.
Like volume and delta, open interest combined with price creates interpretive scenarios. When price is up and open interest is rising, new longs are entering. Buyers are committing fresh capital to the uptrend. This suggests strong bullish conviction. The uptrend has new money behind it. When price is up but open interest is falling, shorts are covering. Price is rising because losing shorts are buying back their positions, not because new longs are entering. This suggests a short squeeze or exhaustion rally. Less sustainable than new buying.
When price is down and open interest is rising, new shorts are entering. Sellers are committing fresh capital to the downtrend. This suggests strong bearish conviction. The downtrend has new money behind it. When price is down but open interest is falling, longs are liquidating. Price is falling because losing longs are selling, not because new shorts are pressing. This suggests long liquidation or capitulation. Less sustainable than new selling.
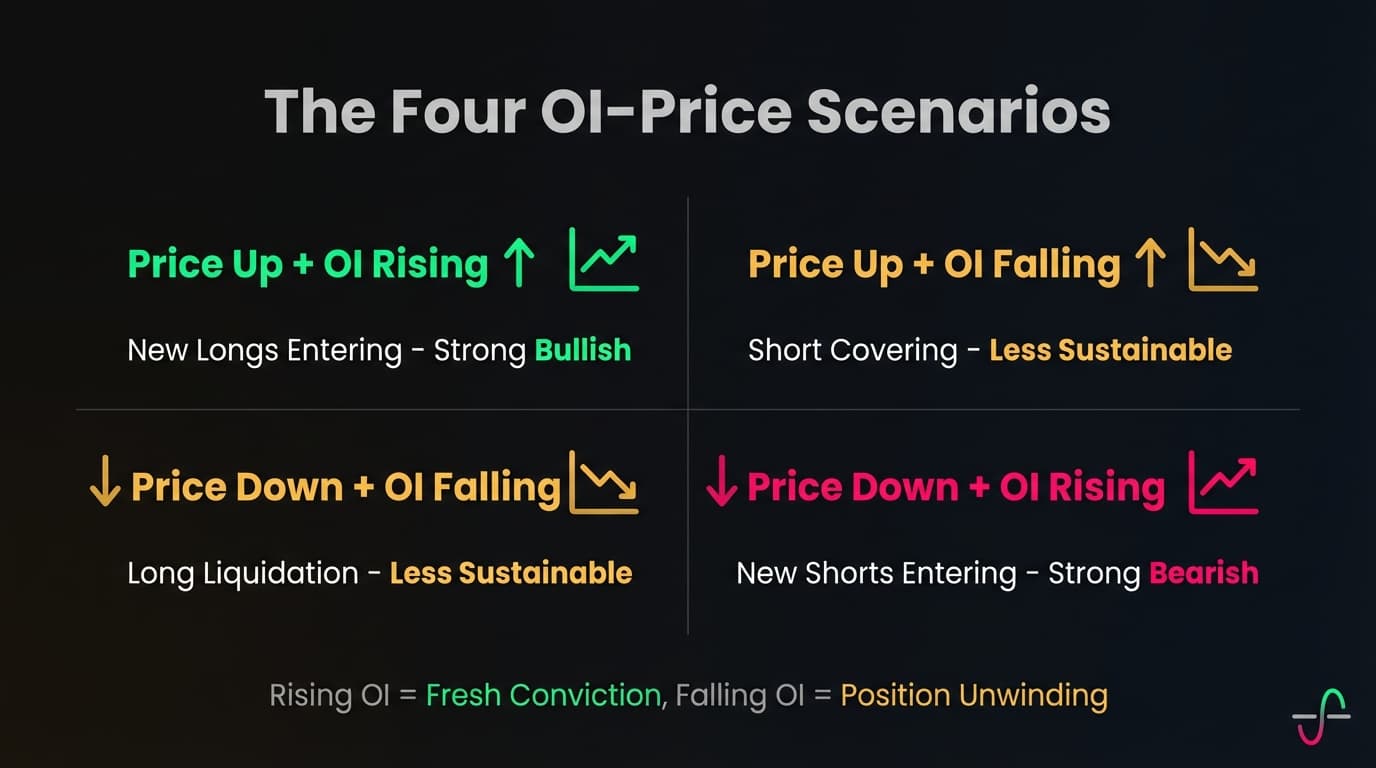
The key insight is that rising open interest confirms the move has fresh conviction. Falling open interest suggests the move is driven by position unwinding, which often exhausts faster.
Most platforms show daily open interest changes. Watch for open interest building during consolidation. New positions are being established while price goes nowhere. Someone is preparing for a move. When it breaks, those positions will fuel momentum. Watch for open interest declining during trends. The trend is losing fresh participation. Existing positions are being reduced. The trend may be exhausting. Watch for open interest spikes on breakouts. New money rushing in confirms the breakout. Breakouts on declining open interest are more suspect. Watch for open interest extremes. Very high open interest relative to historical norms means lots of committed capital. Moves can be violent as that capital scrambles to exit or add. Very low open interest means thin markets with less conviction.
In futures, watch the relationship between OI and price at key levels. A break of support with rising OI, meaning new shorts, is more bearish than a break on falling OI, meaning long liquidation. The first has fresh conviction; the second is just capitulation.
Futures traders watch open interest religiously. As expiration approaches, open interest in the front month declines while open interest in the next month rises. This is normal position rolling, not a directional signal. The Commitment of Traders report shows open interest breakdown by trader type: commercial hedgers, large speculators, small speculators. When commercials are heavily positioned 1 way and speculators the other, it often precedes reversals.
Options open interest adds another dimension. Beyond just how many contracts exist, options open interest reveals put/call ratios. High put open interest relative to call open interest suggests bearish positioning or hedging. High call open interest suggests bullish positioning. Extremes often mark sentiment peaks. Strike clustering shows where open interest is concentrated. Heavy open interest at specific strikes creates pin risk near expiration as market makers hedge their exposure. Max Pain is the strike price where the most options would expire worthless. Markets sometimes gravitate toward max pain as expiration approaches, though this effect is debated. Unusual open interest changes, sudden spikes at specific strikes especially out-of-the-money options, can signal institutional positioning for expected moves.
Open interest is powerful but not predictive. It is delayed. Most exchanges report open interest daily, not in real-time. By the time you see it, the positioning already happened. It does not reveal direction. Rising open interest means new positions, but you do not know if they are longs or shorts without price context. It can be hedging. Not all open interest represents directional bets. Hedgers use futures and options to offset risk, creating open interest that does not reflect speculation. It is market-specific. Open interest exists in derivatives, futures and options, but not in spot or cash markets. Stock traders do not have open interest, though options open interest on stocks can provide clues.
Open interest is most powerful in combination with other tools. Open interest plus volume plus price. High volume, rising open interest, and trending price equals strong directional commitment. High volume, falling open interest, and trending price equals position unwinding, potentially exhausting. Open interest plus delta or CVD. If price is rising with positive CVD, aggressive buyers, and rising open interest, new positions, you have triple confirmation of genuine buying pressure. Open interest plus support or resistance. A breakout through resistance with rising open interest has more weight than 1 with falling open interest. New positions are being established above the level.
The traders who track open interest see a dimension of the market invisible to those watching only price and volume. In futures and options, it is essential information.
Next up: I will show you footprint charts, where you can see the detailed bid/ask battle inside each candle.