Big Trades and Order Bubbles
When an institution needs to get in or out of the market urgently, they leave footprints. Big trades, those unusually large orders that hit the tape, are the fingerprints of aggressive institutional activity. Learning to read them gives you insight into what the biggest players are doing in real-time. When I see a cluster of big trades hitting the market at a specific price, I am seeing actual institutional urgency. That information is worth paying attention to.
Big trades are transactions that significantly exceed normal order size for that market. On ES futures, where typical orders might be 1 to 10 contracts, a 50 plus contract trade is big. On NQ, it might be 20 plus contracts. Most platforms allow you to filter and highlight big trades on the time and sales or display them as bubbles on your chart, larger bubbles for larger orders. These visualizations make institutional activity immediately visible.
A big trade tells you someone just paid the spread to get filled immediately. They crossed the market, hit the bid or lifted the offer, with size. That is urgency. That is conviction.
Big trades show aggressive institutional activity. These are not passive limit orders waiting to be filled. They are market orders or aggressive limits executed immediately at whatever price is available. The size and direction of these trades reveal who is urgent and which way they are pushing.
The meaning of a big trade depends on context. When price is trending higher and you see big trades hitting the ask, aggressive buying, that is institutions adding to positions or entering fresh longs. It confirms the trend has institutional participation. Same logic in reverse. Price trending lower with big trades hitting the bid confirms aggressive institutional selling. This is conviction. Big players are voting with real money in the direction price is already moving.
When price is moving higher but you start seeing big trades hitting the bid, aggressive selling into strength, pay attention. Someone with size is disagreeing with the current direction. It does not mean reversal is guaranteed. The aggressive seller might be hedging or closing a position. But it is information. It tells you that at least 1 large participant sees current prices as an opportunity to sell.
Big trades at support or resistance levels carry extra significance. At support with big buys, institutions are defending that level. They see value at that price and are willing to commit capital. At support with big sells, institutions are not interested in defending or are actively breaking the level. The support may fail. At resistance with big sells, institutions are using that level to distribute or initiate shorts. At resistance with big buys, institutions are absorbing the selling and may push through. The combination of location at a key level and activity big trades creates high-probability contexts.
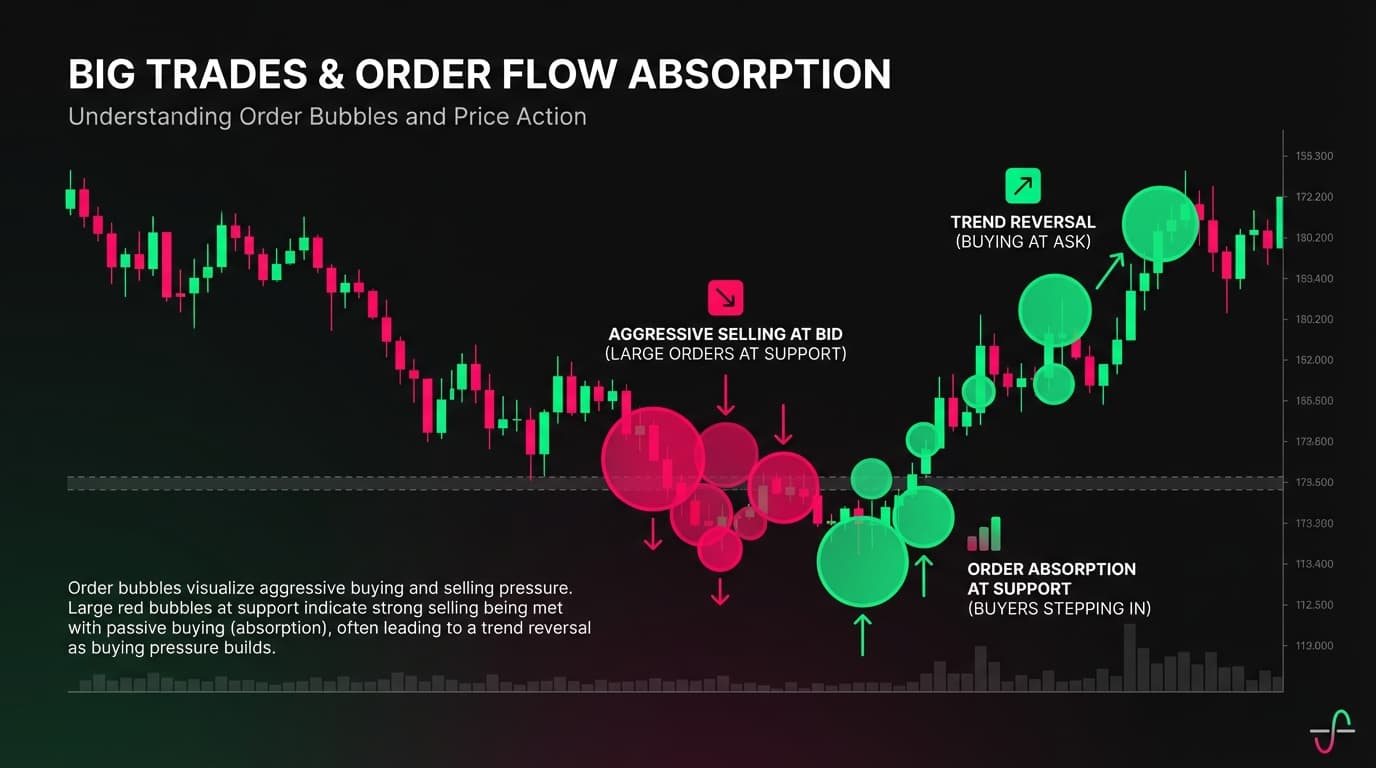
Many charting platforms display big trades as bubbles. The larger the bubble, the larger the order. Bubble color typically shows green or blue bubbles for trades executed at the ask, buyer aggressor, and red or orange bubbles for trades executed at the bid, seller aggressor. The color tells you which side was aggressive, who paid the spread to get filled. Bubble size is relative. A big trade in 1 market is normal in another. You need context for what is typical in your market and timeframe. When you see bubbles significantly larger than recent history, that is notable. A sudden cluster of oversized bubbles indicates institutional activity that stands out from the noise.
Bubble clustering matters more than individual trades. Single big trades matter less than clusters. 1 100-lot hitting the ask could be anything. Ten 100-lots hitting the ask within a few bars is a pattern. That is sustained institutional buying pressure. Look for multiple big trades in the same direction, big trades occurring at similar price levels, and increasing bubble size as price approaches a level.
Do not fixate on individual big trades. Focus on patterns: clusters of big trades in 1 direction, big trades at specific price levels, or big trades that fail to move price (absorption). The pattern tells the story, not the single transaction.
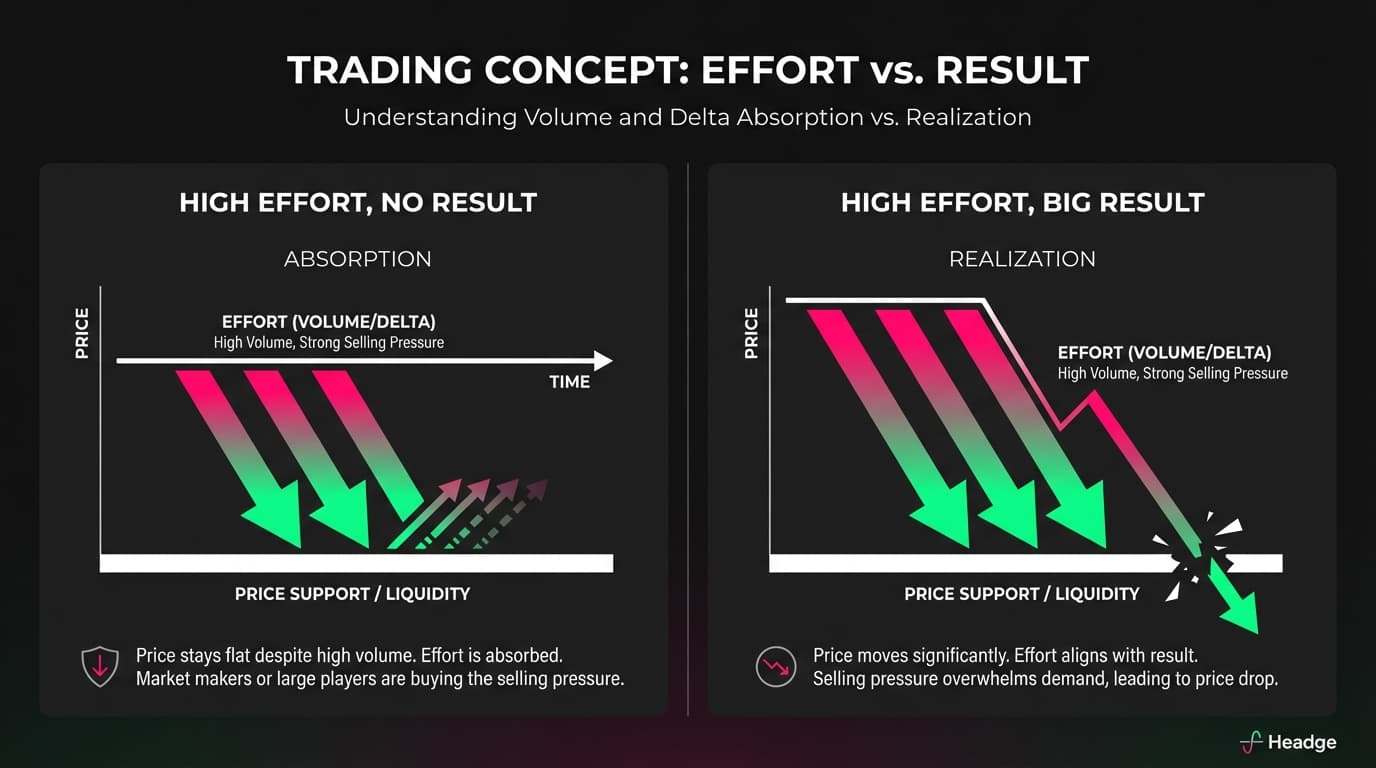
Here is where big trades become powerful. When effort does not match result. Imagine you see a huge cluster of big sell orders, bubbles everywhere, massive delta imbalance, clearly aggressive selling. But price does not drop. It just sits there. What happened? That is absorption. Someone was quietly buying everything those aggressive sellers threw at the market. The visible effort, big sells, produced no result, no price decline. This is often the signature of institutional accumulation. They are absorbing supply without moving price.
The reverse works too. Massive buying that fails to push price higher suggests distribution. Someone is selling into the buying pressure. This is 1 of the most valuable concepts in order flow. Compare the effort, volume, delta, big trades, to the result, price movement. High effort with big result is normal. Heavy buying pushes price up, heavy selling pushes price down. This confirms direction. High effort with no result is absorption. The opposite side is quietly taking the other end of aggressive orders. This is a potential reversal signal. Low effort with big result is a low liquidity move. Price moved on thin volume, suggesting the move may not be sustainable. When you see big trades that do not move price, or a cluster of institutional selling that is immediately absorbed, you are watching a battle. And the side that is absorbing is often the side that wins.
Based on my experience, institutional big trades tend to cluster at specific locations:
- VWAP deviation bands. As discussed earlier, the second standard deviation band often sees institutional participation.
- Volume Profile levels. POC, VAH, VAL, and especially high volume nodes from previous sessions.
- Opening range extremes. The first 30 to 60 minutes establish an initial balance. Big trades often appear when price tests these levels.
- Prior day's levels. Previous day's high, low, close, and POC are watched by institutional algorithms.
- Round numbers. Psychological levels like 4500, 4400, or 4000 on ES often see increased institutional activity.
When big trades appear at these levels, they are more likely to be meaningful. Big trades at random prices in the middle of nowhere carry less weight.
Here is how I incorporate big trades into my trading. Morning preparation. I set my platform to highlight big trades, usually 3 to 5 times normal size for that market. This filter stays on throughout the day. Context establishment. During the first hour, I note where big trades are appearing. Which levels are attracting institutional attention? Which direction are they leaning? Trade confirmation. Before entering a trade, I want to see big trades supporting my direction. If I am looking to buy a pullback to support and I see big trades hitting the ask at that level, that is confirmation. Warning signals. If I am in a position and see big trades appearing against me, especially at a key level, that is a warning. I might tighten stops or reduce size. Failed auction opportunities. When I see a cluster of big trades that fails to move price, I look for entry opportunities in the opposite direction. That absorption often precedes reversal.
Avoid these common mistakes. Overreacting to single trades. 1 big trade does not make a market. Wait for patterns and clusters. Ignoring context. A big trade in isolation means little. The same trade at a key level with other confirmation means a lot. Treating all big trades equally. A 100-lot at the ask during a low-volume lunch hour is different from a 100-lot at the ask during the volatile open. Context matters. Chasing big trades. Seeing big buying and jumping in immediately can put you in a poor location. Use big trades as information, not as immediate triggers.
The best use of big trade data is as 1 input among several. Big trades confirm or question your thesis. They do not create it.
Next up: volume divergences, the early warning signals that appear when price and volume start telling different stories.