Moving Averages
Price charts are noisy. Every tick, every candle contains random fluctuations that obscure the underlying trend. Moving averages cut through that noise by smoothing price over time, revealing the direction that matters. A moving average is simply the average price over a specified number of periods. A 20-period moving average is the average closing price of the last 20 periods. Each period, the oldest price drops off and the newest price adds on, the average moves with price. This simple concept produces 1 of the most useful tools in technical analysis.
The SMA gives equal weight to each period. A 20-period SMA adds the last 20 closes and divides by 20. Every price in the lookback period counts equally. Pros are that it is easy to calculate, widely followed, and stable. Cons are that it is slow to react and treats old prices the same as recent ones. The EMA gives more weight to recent prices. A 20-period EMA still considers 20 periods, but the previous period's price matters more than the price 20 periods ago. Pros are that it reacts faster to recent price changes. Cons are that it is more prone to whipsaws and slightly more complex. Both work. Many traders obsess over this choice, but the difference is minor. The SMA is smoother and better for identifying major trends. The EMA is faster and better for short-term signals. Pick 1 and stay consistent, the exact moving average matters less than how you use it.
A 50-period SMA and 50-period EMA will look nearly identical on a chart. Switching from 50 to 20 periods makes a much bigger difference than switching from SMA to EMA. Focus on choosing the right lookback period for your trading timeframe.
Different periods serve different purposes. Short-term 8 to 20 periods tracks immediate trend direction, is useful for entries and exits in established trends, whipsaws frequently in choppy markets, with popular choices being 9 EMA, 10 SMA, and 20 EMA. Medium-term 50 periods is the most widely-watched moving average, represents roughly 10 weeks of daily data, offers good balance between responsiveness and smoothness, and institutions and algorithms track the 50-period MA. Long-term 100 to 200 periods defines the major trend. The 200-period MA is the line in the sand for bull versus bear markets. Price above 200 MA equals bullish regime. Price below 200 MA equals bearish regime.
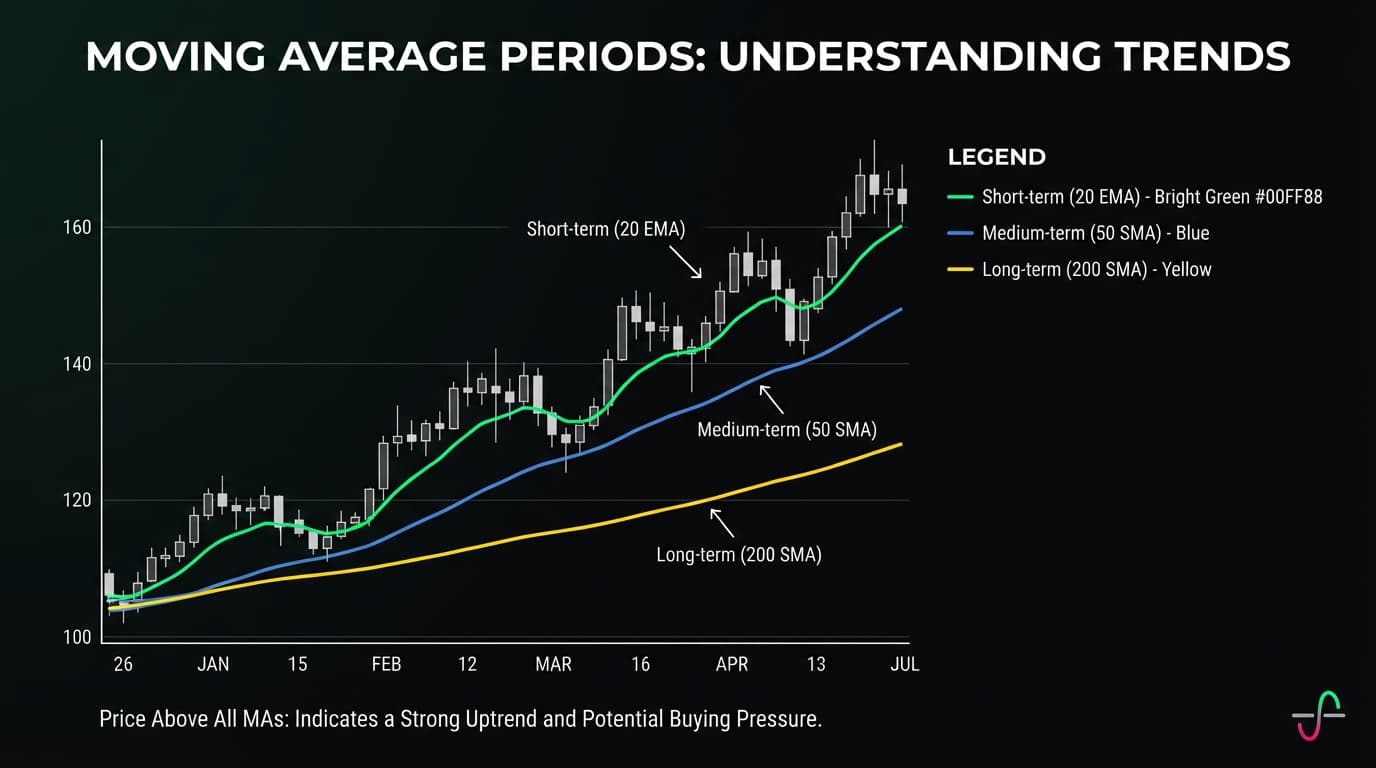
The simplest use is to look at the MA slope. MA sloping up equals uptrend. MA sloping down equals downtrend. MA flat equals range or transition. A 50-period MA with a clear upward slope tells you the trend is up, regardless of day-to-day fluctuations. Where price sits relative to the moving average indicates trend. Price consistently above MA equals uptrend. Price consistently below MA equals downtrend. Price crossing back and forth equals no clear trend. In strong uptrends, price rarely touches the 20 EMA. In weak trends or ranges, price constantly crosses the MA.
Using 2 or more MAs together provides clearer signals. Fast above slow equals bullish. 20 EMA above 50 SMA suggests uptrend. The faster MA leads, the slower MA confirms. Fast below slow equals bearish. 20 EMA below 50 SMA suggests downtrend. MAs tangled equals no trend. When fast and slow MAs weave together, the market is ranging.
Crossovers generate entry and exit signals. The golden cross is when the 50-period MA crosses above the 200-period MA. This signals a potential shift from bearish to bullish conditions. It is a lagging signal, the trend has already been changing, but it confirms the shift for longer-term traders. The death cross is when the 50-period MA crosses below the 200-period MA. This signals a potential shift from bullish to bearish conditions. Like the golden cross, it is lagging but confirming. Faster crossovers like 9 EMA crossing 21 EMA generate more frequent signals. Useful for shorter-term traders but prone to whipsaws in choppy markets.
Crossover signals are lagging indicators, they confirm trends that have already begun. In strong trending markets, they keep you on the right side. In choppy markets, they generate repeated false signals. Do not rely on crossovers alone, use them with other confirmation.
In trending markets, moving averages act as dynamic support and resistance. In uptrend behavior, price pulls back to the 20 EMA, finds buyers, and bounces. Deeper pullbacks find support at the 50 SMA. The 200 SMA acts as major support in strong bull markets. In downtrend behavior, price bounces to the 20 EMA, finds sellers, and drops. Stronger bounces face resistance at the 50 SMA. The 200 SMA acts as major resistance in bear markets. When price pulls back to a rising MA, wait for price to touch or approach the MA, look for a reversal candle pattern, enter long with stop below the MA, and target the previous high or higher. This works best in established trends. In ranges, MAs offer no reliable support or resistance.
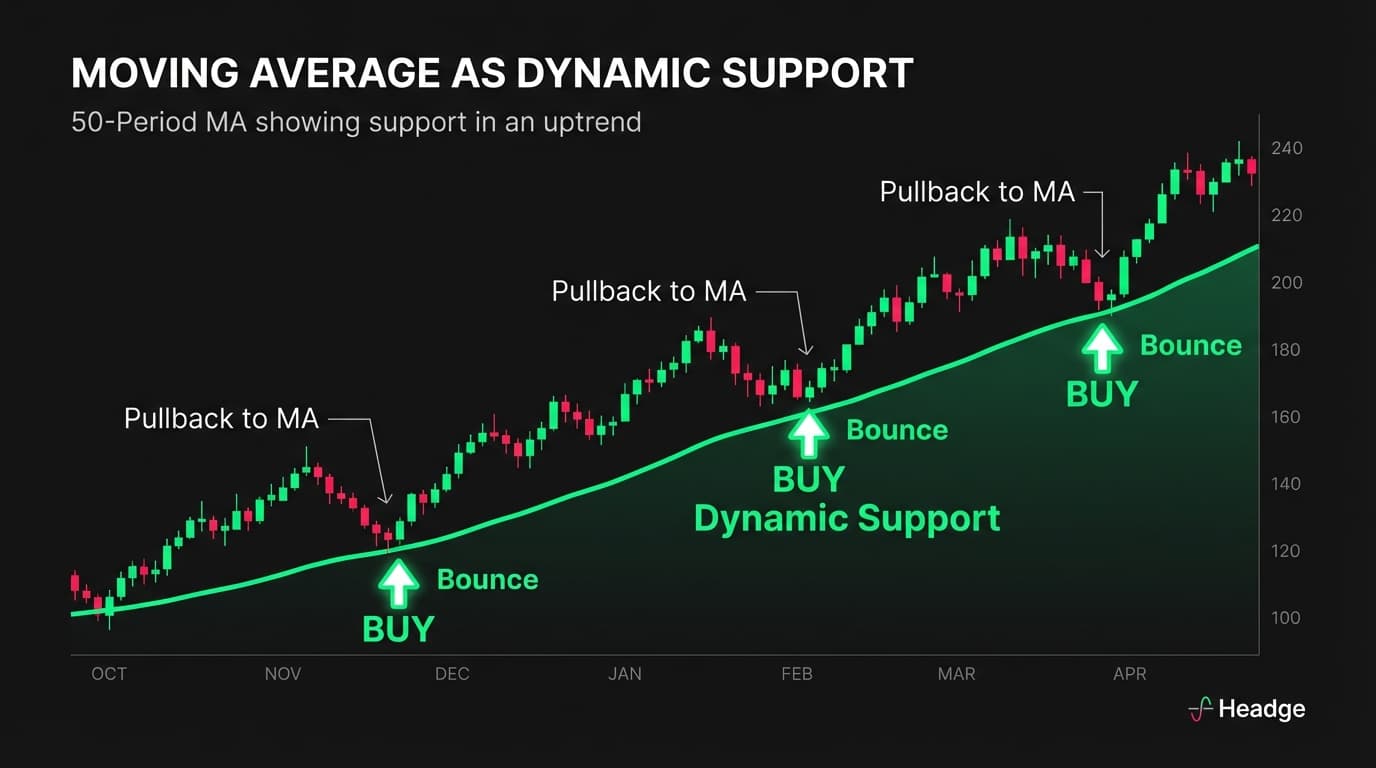
Use a longer MA to determine trade direction. Only take long trades when price is above the 200 SMA. Only take short trades when price is below the 200 SMA. This simple filter keeps you aligned with the major trend and avoids fighting momentum. In an established uptrend, wait for price to pull back to the 20 or 50 MA, wait for a bullish candle to form, enter long with stop below the MA, and ride the trend continuation. Plot bands a certain percentage above and below a MA, like 3% above and below the 20 SMA. Price touching the upper band in an uptrend can signal overextension. Price touching the lower band can signal a buy opportunity. Check the 50 MA on both the daily and weekly charts. If both point up, strong uptrend. If daily up but weekly down, mixed signal. If both point down, strong downtrend. Alignment across timeframes increases confidence.
Moving averages are not magic. They are lagging by nature. MAs are calculated from past prices. They will never call the exact top or bottom. By the time the MA signals a trend change, part of the move is already over. They are useless in ranges. When price chops sideways, MAs generate false signal after false signal. The crossovers that work in trends become expensive whipsaws in ranges. They are not predictive. A MA tells you what happened, not what will happen. Price touching the 50 MA does not guarantee a bounce, it might slice right through. Period sensitivity means a strategy that works great with a 20 EMA might fail with a 21 EMA. This suggests the edge might be curve-fitting rather than something real.
To develop your own MA approach, match period to timeframe. Day traders might use 9 and 20 EMAs on 5-minute charts. Swing traders might use 20 and 50 SMAs on daily charts. Position traders might use 50 and 200 on weekly charts. Test in trending and ranging markets. Any MA setup will look great in trends and terrible in ranges. Understand when your approach works and when to step aside. Combine with other tools. MAs work best as 1 input among many. Combine with support and resistance, volume, and candlestick patterns for higher-probability setups. Stay consistent. The specific MA matters less than consistent application. Jumping between 20, 50, and 100-period MAs searching for the best 1 is a waste of time.
Moving averages will not make you rich on their own. They will keep you oriented in trending markets and provide objective reference points for analysis. That is valuable, even if it is not glamorous.
Next, I will cover momentum indicators, RSI, MACD, and other tools that measure the strength behind price movement.