Risk/Reward Ratios
You have probably heard the advice. Only take trades with at least a 3 to 1 risk-reward ratio. It sounds sensible. Risk $100 to make $300. What could go wrong? A lot, actually. That advice, while not entirely wrong, misses half the picture. And the half it misses is the half that matters most.
Let me be precise about what I am measuring. Risk-reward ratio compares how much you stand to lose against how much you stand to gain. You buy ES at 4500.00. Your stop loss is at 4498.00. Your target is 4506.00. Risk is 4500.00 minus 4498.00 equals 2 points. Reward is 4506.00 minus 4500.00 equals 6 points. Risk-reward ratio is 1 to 3, or 3R. For every point you risk, you are targeting 3 points of profit. Sounds great. But here is what the simple ratio does not tell you. How often does the trade actually hit that target?
A 3 to 1 risk-reward ratio means nothing in isolation. You need to know your win rate. Consider 2 traders. Trader A takes 3 to 1 trades with a 20% win rate. Out of 10 trades, 2 winners and 8 losers. Profit from winners is 2 times $300 equals $600. Loss from losers is 8 times $100 equals $800. Net result is negative $200. Trader B takes 1 to 1 trades with a 60% win rate. Out of 10 trades, 6 winners and 4 losers. Profit from winners is 6 times $100 equals $600. Loss from losers is 4 times $100 equals $400. Net result is positive $200.
Trader B, with the inferior 1 to 1 ratio, makes money. Trader A, chasing the superior 3 to 1 ratio, loses money. The ratio alone told you nothing useful.
What matters is expectancy, calculated as win rate times average win minus loss rate times average loss. A positive expectancy means you make money over time. The risk-reward ratio is just 1 variable in this equation, not the whole answer.
Here is the uncomfortable reality. Risk-reward and win rate are inversely related. As you demand higher reward relative to risk, your win rate drops. Why? Because wider targets are harder to reach. If you are targeting 6 points profit with a 2 point stop, the market needs to move 3 times further in your favor than against you. The further price needs to travel, the more opportunity for the trade to reverse, for news to hit, for the market to do something unexpected.
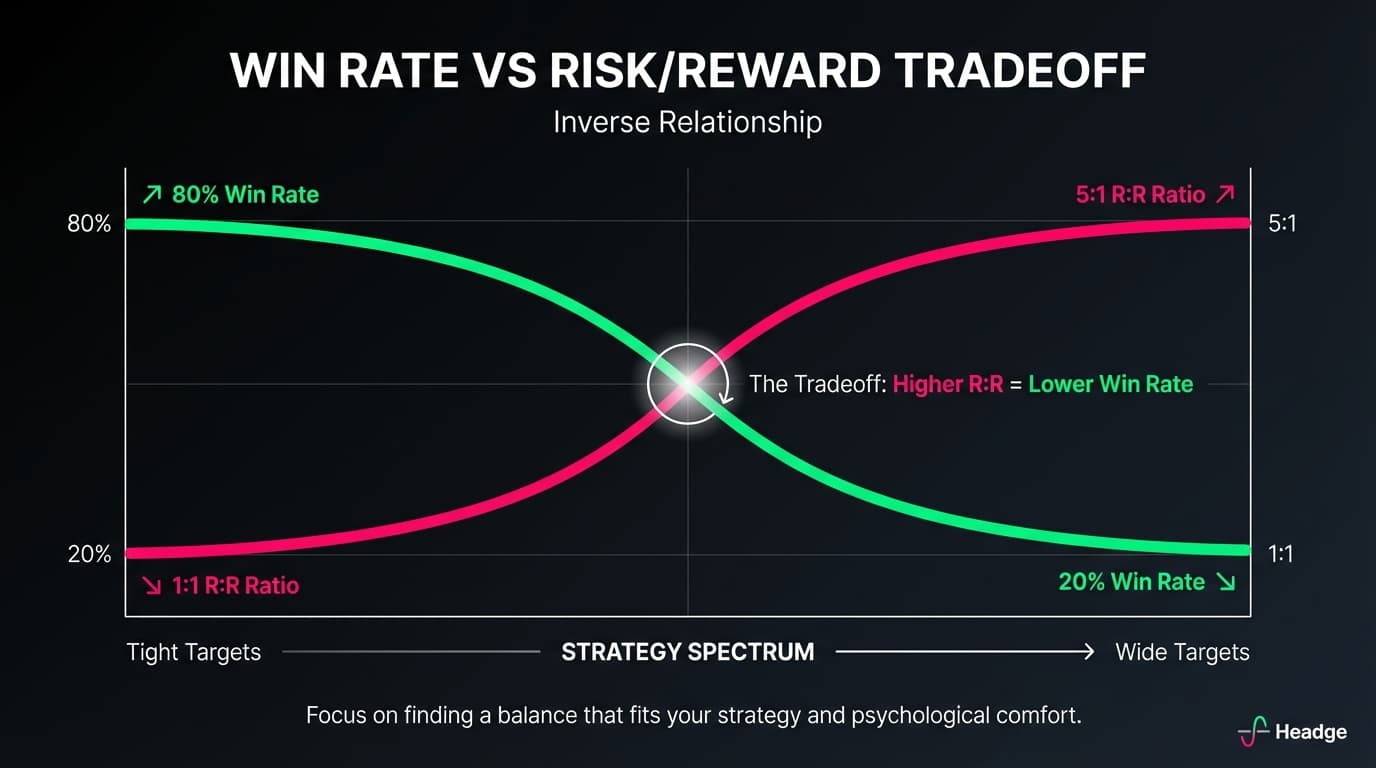
Tight targets with wide stops give you high win rates but small average wins. Wide targets with tight stops give you large wins but low win rates. You cannot have both. The sweet spot varies by strategy, market, and trader psychology. Some traders thrive with lots of small wins and occasional larger losses. Others prefer fewer, larger wins and can stomach long losing streaks. Neither approach is inherently superior.
Professional traders often think in terms of R-multiples rather than dollar amounts. R represents your initial risk on a trade. If you risk $500 on a trade, 1R equals $500, which is breakeven after costs. 2R equals $1,000 profit. 3R equals $1,500 profit. Negative 1R equals $500 loss, which is getting stopped out. This standardization lets you compare performance across different position sizes and different trades. A $10,000 profit on a trade where you risked $10,000 is a 1R win. A $1,000 profit on a trade where you risked $200 is a 5R win. The second trade was actually better, despite the smaller dollar amount.
When you track your trades in R-multiples, patterns emerge. You might find your average winner is 2.1R, your average loser is negative 1.0R, which is hitting the full stop, your win rate is 45%, giving you an expectancy of 0.45 times 2.1 minus 0.55 times 1.0, which equals 0.945 minus 0.55, which equals 0.395R per trade. Over 100 trades risking $500 each, this translates to roughly $19,750 profit. The R-multiple framework makes this calculation clean and comparable across time periods.
Start tracking your trades in R-multiples immediately. After 30 to 50 trades, you will have a clear picture of your actual expectancy, not what you hope it is.
Always aim for 3 to 1 has become trading gospel. But watch what happens when traders rigidly apply this rule. They pass on perfectly good 1.5 to 1 setups that have a 65% win rate, which is positive expectancy. They hold winners too long, watching 2R profits evaporate while waiting for 3R, eventually getting stopped out at 1R or breakeven. They set arbitrary targets that have no relation to actual market structure, support, or resistance. They force trades to fit the ratio by using stops that are too tight, getting stopped out on normal noise. The 3 to 1 rule is not wrong as a starting point for beginners. It builds discipline around not taking every marginal setup. But treating it as law rather than guideline creates its own problems.
The right risk-reward ratio depends on the specific trade, not a universal rule. Market structure matters. Your target should align with where the market is likely to find resistance for longs or support for shorts. If there is obvious resistance 4 points above your entry and you need 6 points to hit 3 to 1, you are setting yourself up to watch the trade reverse at 4 points and give back your profit. A 2 to 1 trade into clear air is better than a 3 to 1 trade through major resistance.
Volatility matters. In high-volatility conditions, prices overshoot in both directions. Wider targets and stops make sense. In low-volatility, choppy markets, tight targets with reasonable stops often work better. Time frame matters. Scalpers might work with 1 to 1 or even lower ratios because they are taking many trades with high win rates. Swing traders might need 2 to 1 or 3 to 1 because they are taking fewer trades and can tolerate lower win rates. Your psychology matters. Can you sit through a 40% win rate, even knowing it is profitable? Many traders cannot. They start second-guessing, adjusting stops, cutting winners early. If that is you, a lower R to R strategy with higher win rate might produce better actual results, even if it looks suboptimal on paper.
Given your actual or estimated win rate, you can calculate the minimum risk-reward ratio needed to break even. Minimum R to R equals 1 minus win rate divided by win rate. With a 50% win rate, minimum R to R equals 0.5 divided by 0.5, which equals 1 to 1. With a 40% win rate, minimum R to R equals 0.6 divided by 0.4, which equals 1.5 to 1. With a 33% win rate, minimum R to R equals 0.67 divided by 0.33, which equals 2 to 1. With a 25% win rate, minimum R to R equals 0.75 divided by 0.25, which equals 3 to 1.
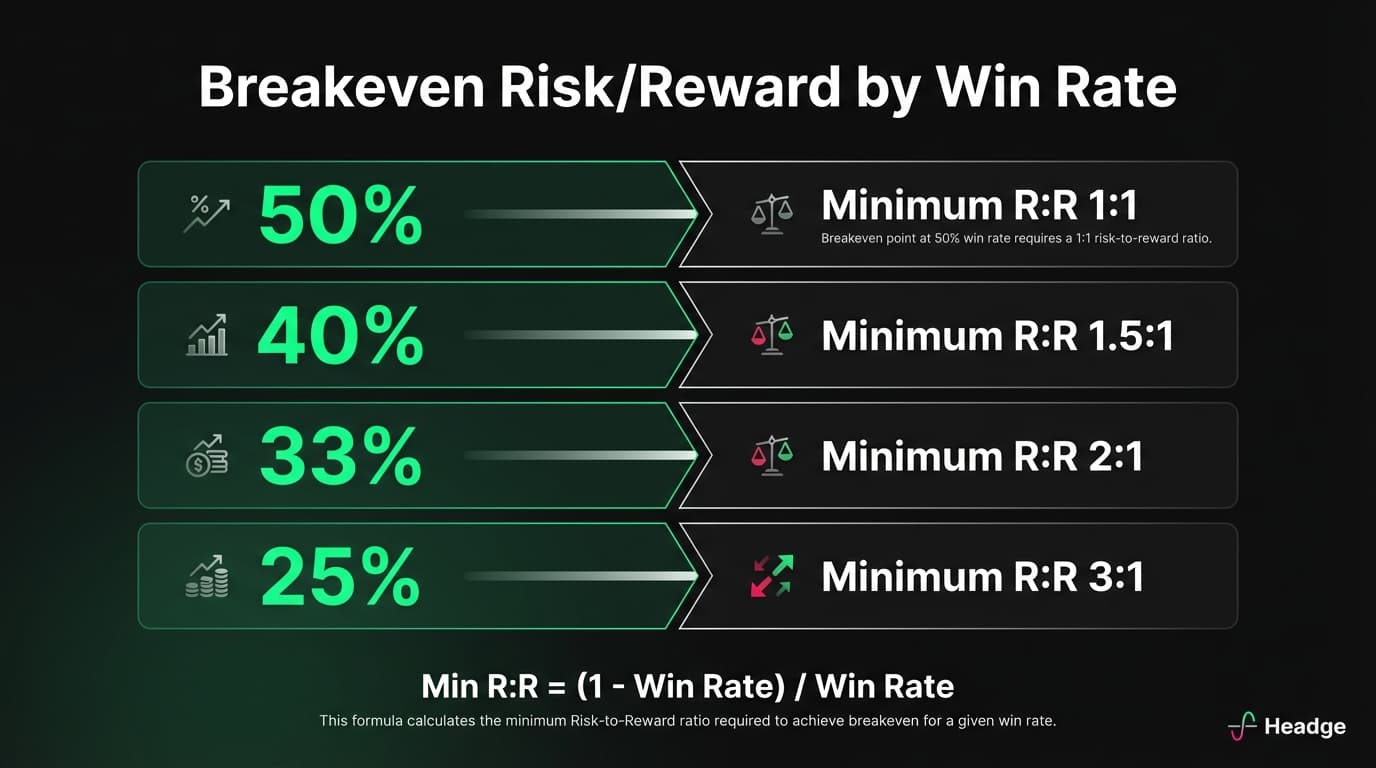
This is your breakeven threshold. You need to exceed this to actually make money. If your strategy wins 40% of the time, you need better than 1.5 to 1 on average just to stay flat.
Stop chasing arbitrary ratios. Start measuring your actual performance. Track every trade in R-multiples. After 30 plus trades, calculate your average winner, average loser, and win rate. Calculate your expectancy. If expectancy is positive, you have an edge. Protect it with proper position sizing. If expectancy is negative, either improve your entries, improve your exits, or find a different strategy. The traders who succeed are not the ones with the highest risk-reward ratios. They are the ones who know their actual numbers and have the discipline to keep taking positive expectancy trades through the inevitable losing streaks.
Next up: I will explore maximum drawdown, the mathematics of recovery, and why a 50% loss requires a 100% gain to get back to breakeven.