Maximum Drawdown
Your account is at $50,000. A rough month brings it down to $35,000. You are down 30%. Bad, but recoverable, right? Here is the problem. To get back to $50,000, you do not need a 30% gain. You need a 43% gain. The math works against you in ways that are not intuitive, and it gets worse the deeper you go. This asymmetry between losses and recovery is why drawdown management is not just another risk concept. It is the difference between temporary setback and permanent damage.
When you lose money, you are calculating the loss from a larger base. When you recover, you are calculating gains from a smaller base. This creates an asymmetry that compounds as losses deepen. A 10% drawdown requires 11% to recover. A 20% drawdown requires 25%. A 30% drawdown requires 43%. A 40% drawdown requires 67%. A 50% drawdown requires 100%. A 60% drawdown requires 150%. A 70% drawdown requires 233%. An 80% drawdown requires 400%. A 90% drawdown requires 900%.
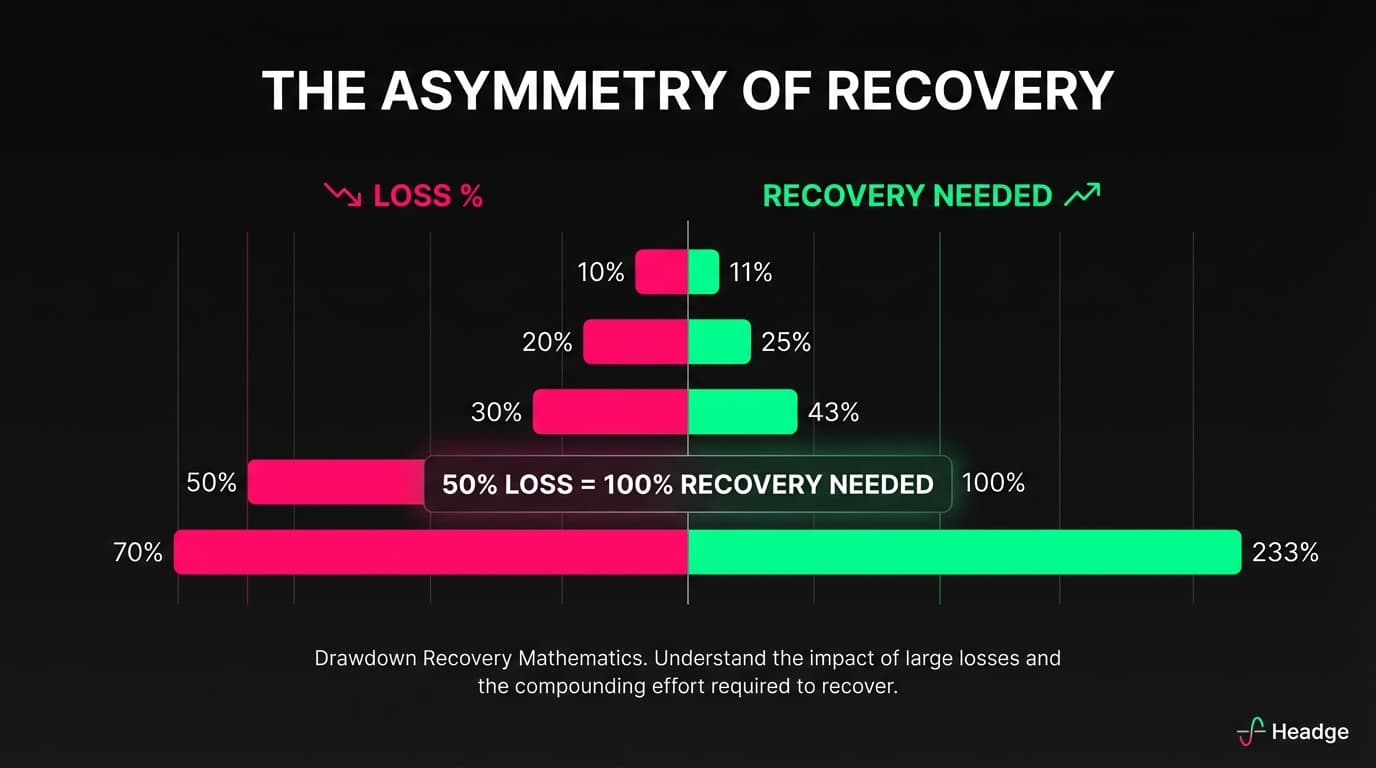
Look at those numbers carefully. A 50% drawdown requires a 100% return just to get back to breakeven. A 70% drawdown needs a 233% return. At 90% down, you need to 10 times your remaining capital. These are not theoretical numbers. Traders hit these drawdowns regularly. And most never recover, not because they cannot trade, but because the math becomes impossible.
A 50% loss requires a 100% gain to recover. This asymmetry means that avoiding large drawdowns is more important than chasing large gains. The deeper the hole, the harder it is to climb out.
Maximum drawdown or MDD is the largest peak-to-trough decline in your account before a new peak is reached. It measures the worst losing period you have experienced. If your account went from $50,000 to $60,000, then dropped to $42,000, then recovered to $65,000, your peak was $60,000, your trough was $42,000, and your maximum drawdown was $60,000 minus $42,000 divided by $60,000, which equals 30%. The MDD tells you the worst pain you have had to endure. It is the number that keeps traders up at night, wondering if the strategy is broken or if this is just normal variance.
Current drawdown is where you are now relative to your equity peak. Maximum drawdown is the worst it has ever been. You might be in a 15% current drawdown while your maximum drawdown historically is 25%. This context matters. If you have seen 25% before and recovered, 15% feels manageable. If 15% is your worst ever, you do not know yet how much worse it might get.
Drawdowns are not just mathematical. They are psychological warfare. At 10% down, most traders are annoyed but functional. At 20%, doubt creeps in. At 30%, the strategy that made perfect sense 2 months ago now seems fundamentally flawed. At 40%, traders start doing desperate things. Increasing size to make it back faster, abandoning their system, revenge trading.
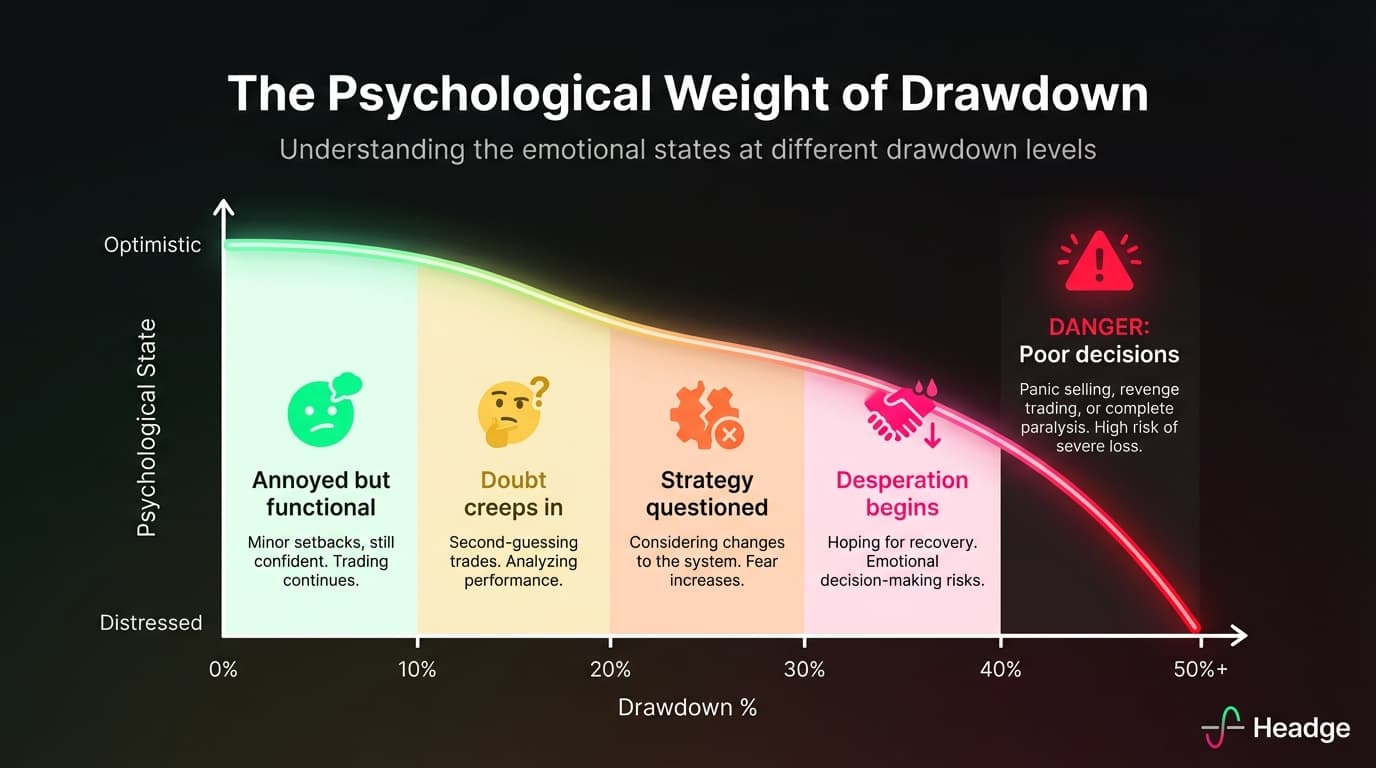
The cruel irony is that the deeper the drawdown, the more disciplined you need to be, but the less capable you are of maintaining discipline. This is why drawdown limits exist. To stop you before you reach the point where good decisions become impossible.
Professional traders and funds set explicit drawdown limits before they start trading. These are non-negotiable circuit breakers. Account-level limits might be maximum drawdown of 20% to 25%, beyond which you stop trading entirely, and trigger for reduced size at 10% to 15%, where you cut position size in half. Time-based limits might be daily loss limit of 2% to 3% where you stop trading for the day, weekly loss limit of 5% to 6% where you reduce size or stop for the week, and monthly loss limit of 10% where serious review is required.
These limits only work if you actually follow them. Writing stop at 20% down in your trading plan means nothing if you ignore it when you hit 20%. The limit must be a hard stop, not a suggestion.
The point is not to prevent all losses. Losses are inevitable. The point is to prevent catastrophic losses that threaten your ability to continue. If your maximum acceptable drawdown is 20%, and your per-trade risk is 1%, you can lose 20 trades in a row before hitting your limit. That is a significant buffer. It gives your strategy room to experience normal variance without triggering an account-threatening event. But if you are risking 5% per trade, 4 consecutive losses put you at the limit. That is not a buffer. That is a tightrope.
Even with good returns, recovering from drawdowns takes time. Consider a trader who is down 30% and can generate 20% annual returns, which is excellent. Starting point is $35,000, down from $50,000. After year 1, the account is at $42,000. After year 2, the account is at $50,400. It takes 2 years of strong performance just to get back to the original high water mark. 2 years of solid trading with nothing to show for it except erasing past mistakes.
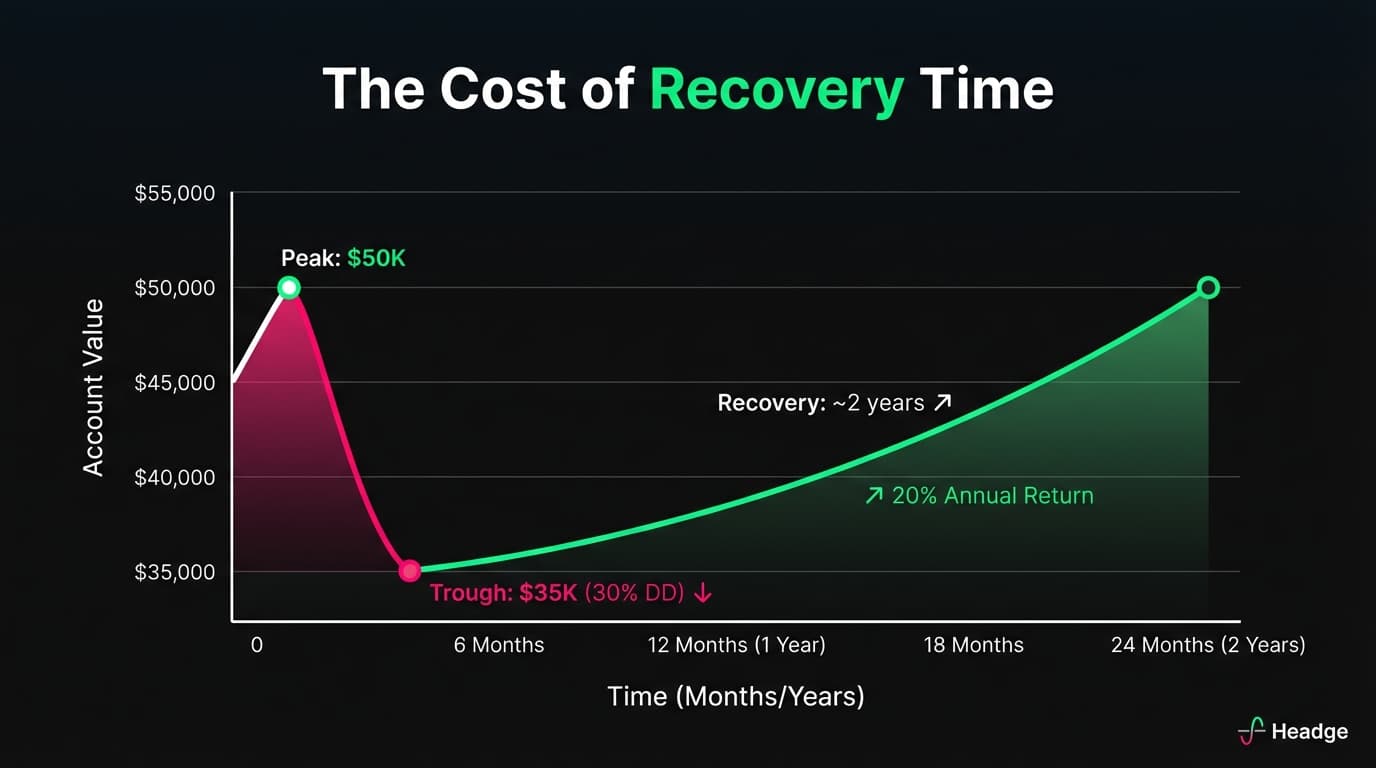
This is why avoiding large drawdowns matters more than maximising gains. The opportunity cost of recovery time is enormous. Every month spent climbing out of a hole is a month not spent compounding from new highs.
Even legendary traders experience significant drawdowns. Renaissance Technologies' Medallion Fund has seen drawdowns of 10% to 20%. Warren Buffett's Berkshire Hathaway has had multiple 40% plus drawdowns. George Soros's Quantum Fund saw 20% plus drawdowns multiple times. Paul Tudor Jones has spoken about experiencing 20% plus drawdowns early in his career. The difference between these traders and those who blow up is that they survived the drawdowns. Their position sizing and risk management ensured that even significant drawdowns did not threaten their ability to continue trading.
1 practical response to drawdowns is scaling down position size. The logic is straightforward. When you are losing, you should be risking less, both to preserve capital and to reduce psychological pressure. A simple framework works like this. At 0% to 5% drawdown, trade at 100% normal size. At 5% to 10% drawdown, reduce to 75% normal size. At 10% to 15% drawdown, reduce to 50% normal size. At 15% to 20% drawdown, reduce to 25% normal size. Above 20% drawdown, stop trading and review.
This automatic scaling accomplishes several things. It slows the drawdown by reducing exposure. It reduces emotional pressure by lowering stakes. It preserves capital for when conditions improve. It forces reflection before returning to full size. The traders who scale down during drawdowns often find that the reduced pressure actually improves their decision-making, leading to faster recovery than if they had maintained full size.
Every significant drawdown should be documented. Note what the peak equity was, what the trough was, how long it lasted, what caused it whether market conditions, overtrading, or strategy failure, how you behaved during it, and what you would do differently. This record becomes invaluable over time. You will notice patterns. Maybe your drawdowns cluster around certain market conditions, or maybe they follow periods of overconfidence after a winning streak. The journal reveals what your P&L statement hides.
Here is the 1 rule that separates survivors from casualties. Never let a manageable drawdown become an unmanageable 1. A 10% drawdown is uncomfortable. A 20% drawdown is painful but recoverable with discipline. A 40% drawdown changes the entire equation, requiring exceptional returns over extended periods just to break even. Your job is to stay in the first 2 categories. The position sizing, the limits, the scaling, all of it exists to keep you from ever reaching the third category. Because once you are there, skill matters far less than luck.
Next up: I will explore the psychology of taking losses, why it is so difficult, and how the best traders reframe their relationship with losing trades.